Portfolio
-Selected Projects-
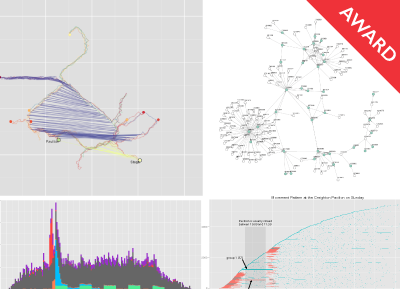
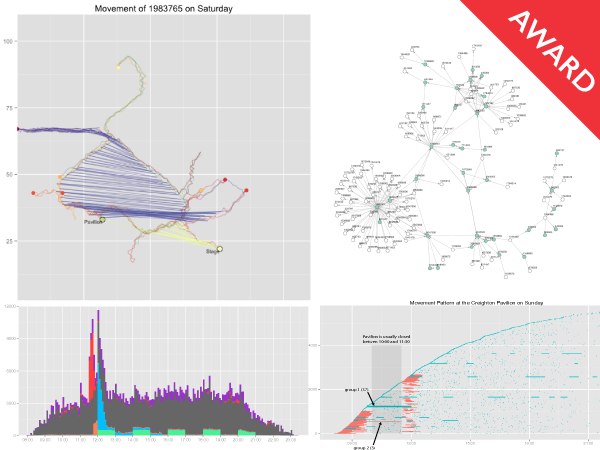
VAST Challnge 2015
Geospatial Data
Gapmap
R package
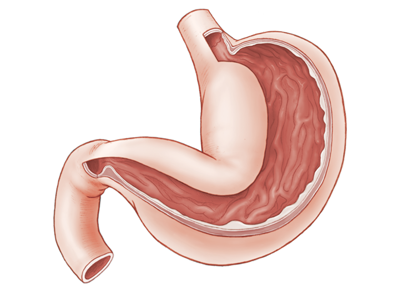
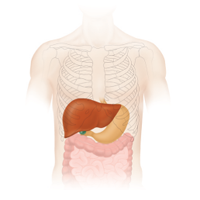
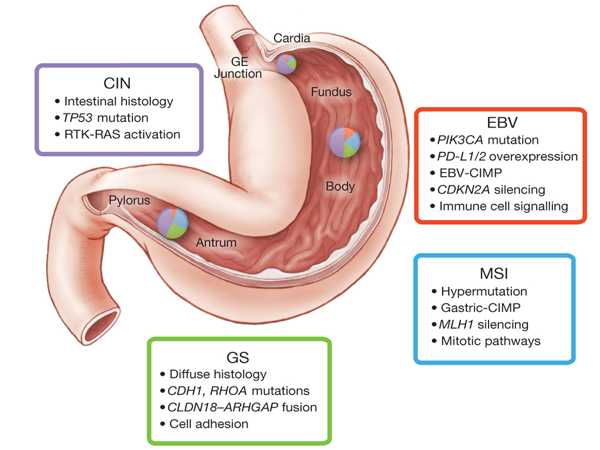
Anatomical Illustration
Publication Figure
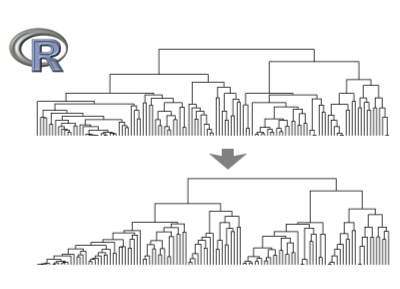
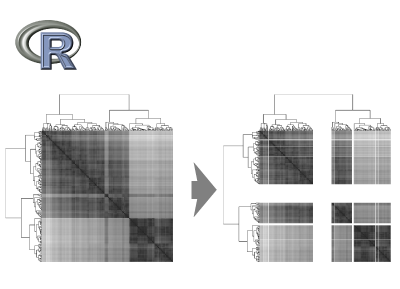
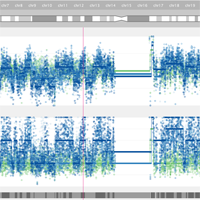
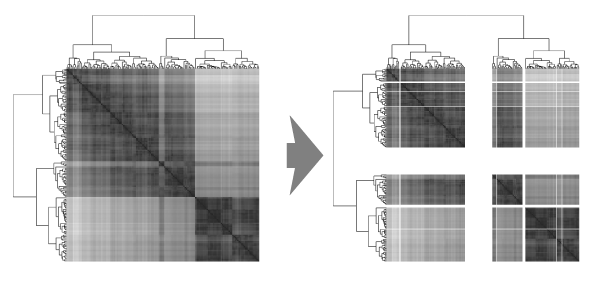
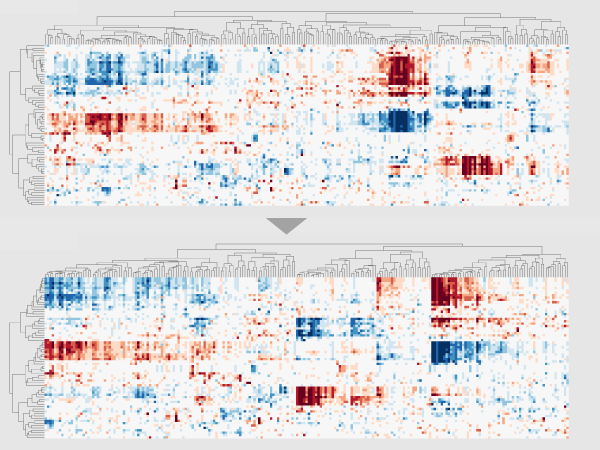
Dendsort
R package

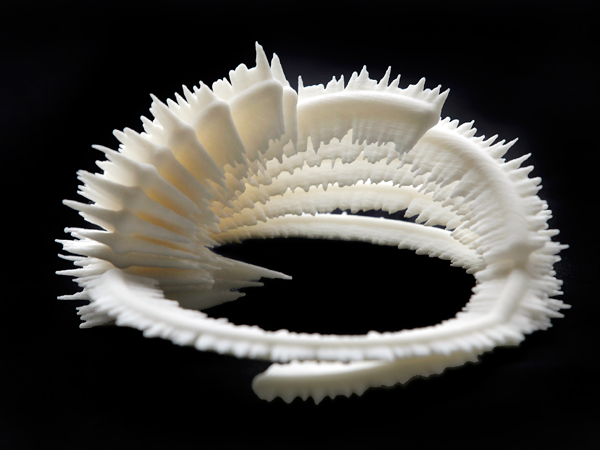
Cosmoplitan Chicken Research Project
Data Sculpture
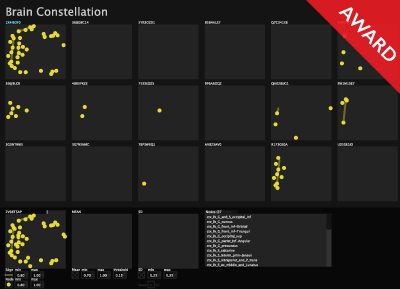
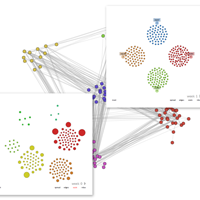
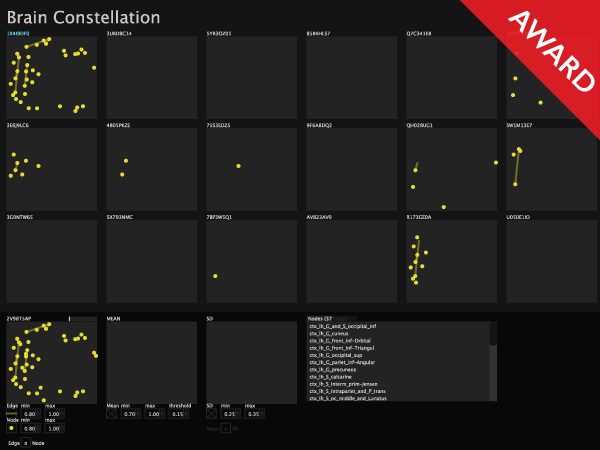
Brain Constellation
resting-state functional connectivity networks
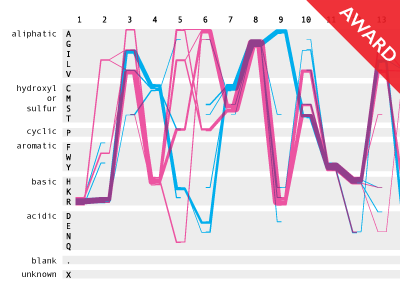
Sequence Diversity Diagram
Protein Sequence Alignment Sets Visualization
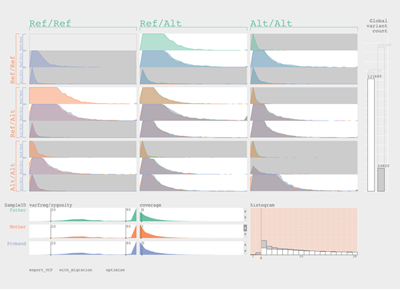
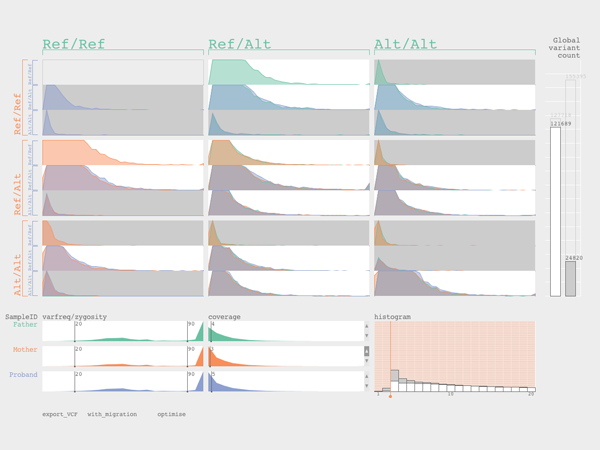
TrioVis
Bioinformatics Tool
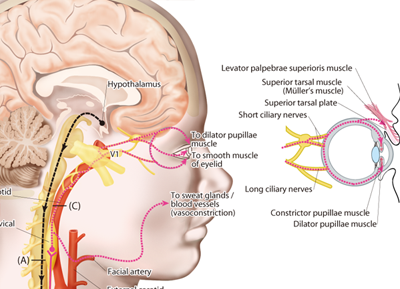
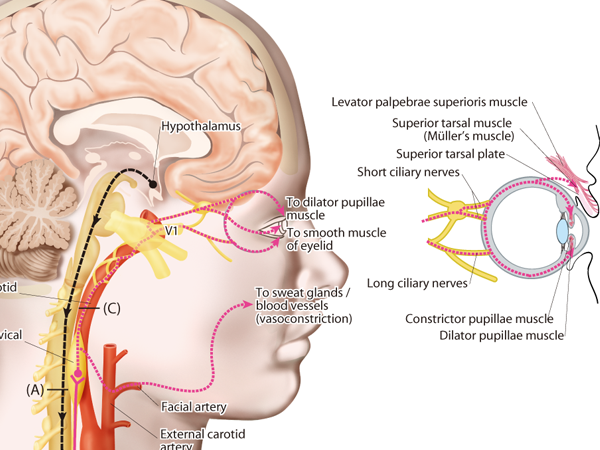
Horner's Syndrome
Textbook Illustration


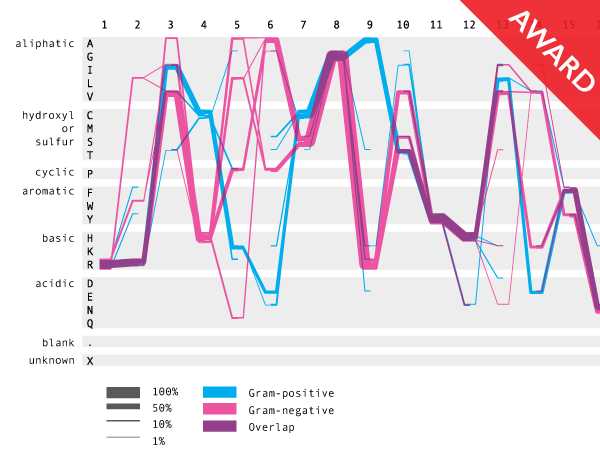
 The original Sequence Logo figure.
 First prototype.